

Pick a date range
The date button at the top left sets the range. It starts on Last 30 days.1
Open the date picker
Click the date button.
2
Pick a range
Pick Today, Yesterday, Last 7 days, Last 30 days, This
month, or Last month. Or click a start date and an end date on the
calendar.
Filter by job, department, or status
Click Filters and pick one:
Each filter you set shows as a chip next to Filters. Click the x on a chip to remove it.
Filters apply to every card except Careers page visits, which only shows with no filters set, and Equal opportunity, which only follows the Job filter.
Summary cards
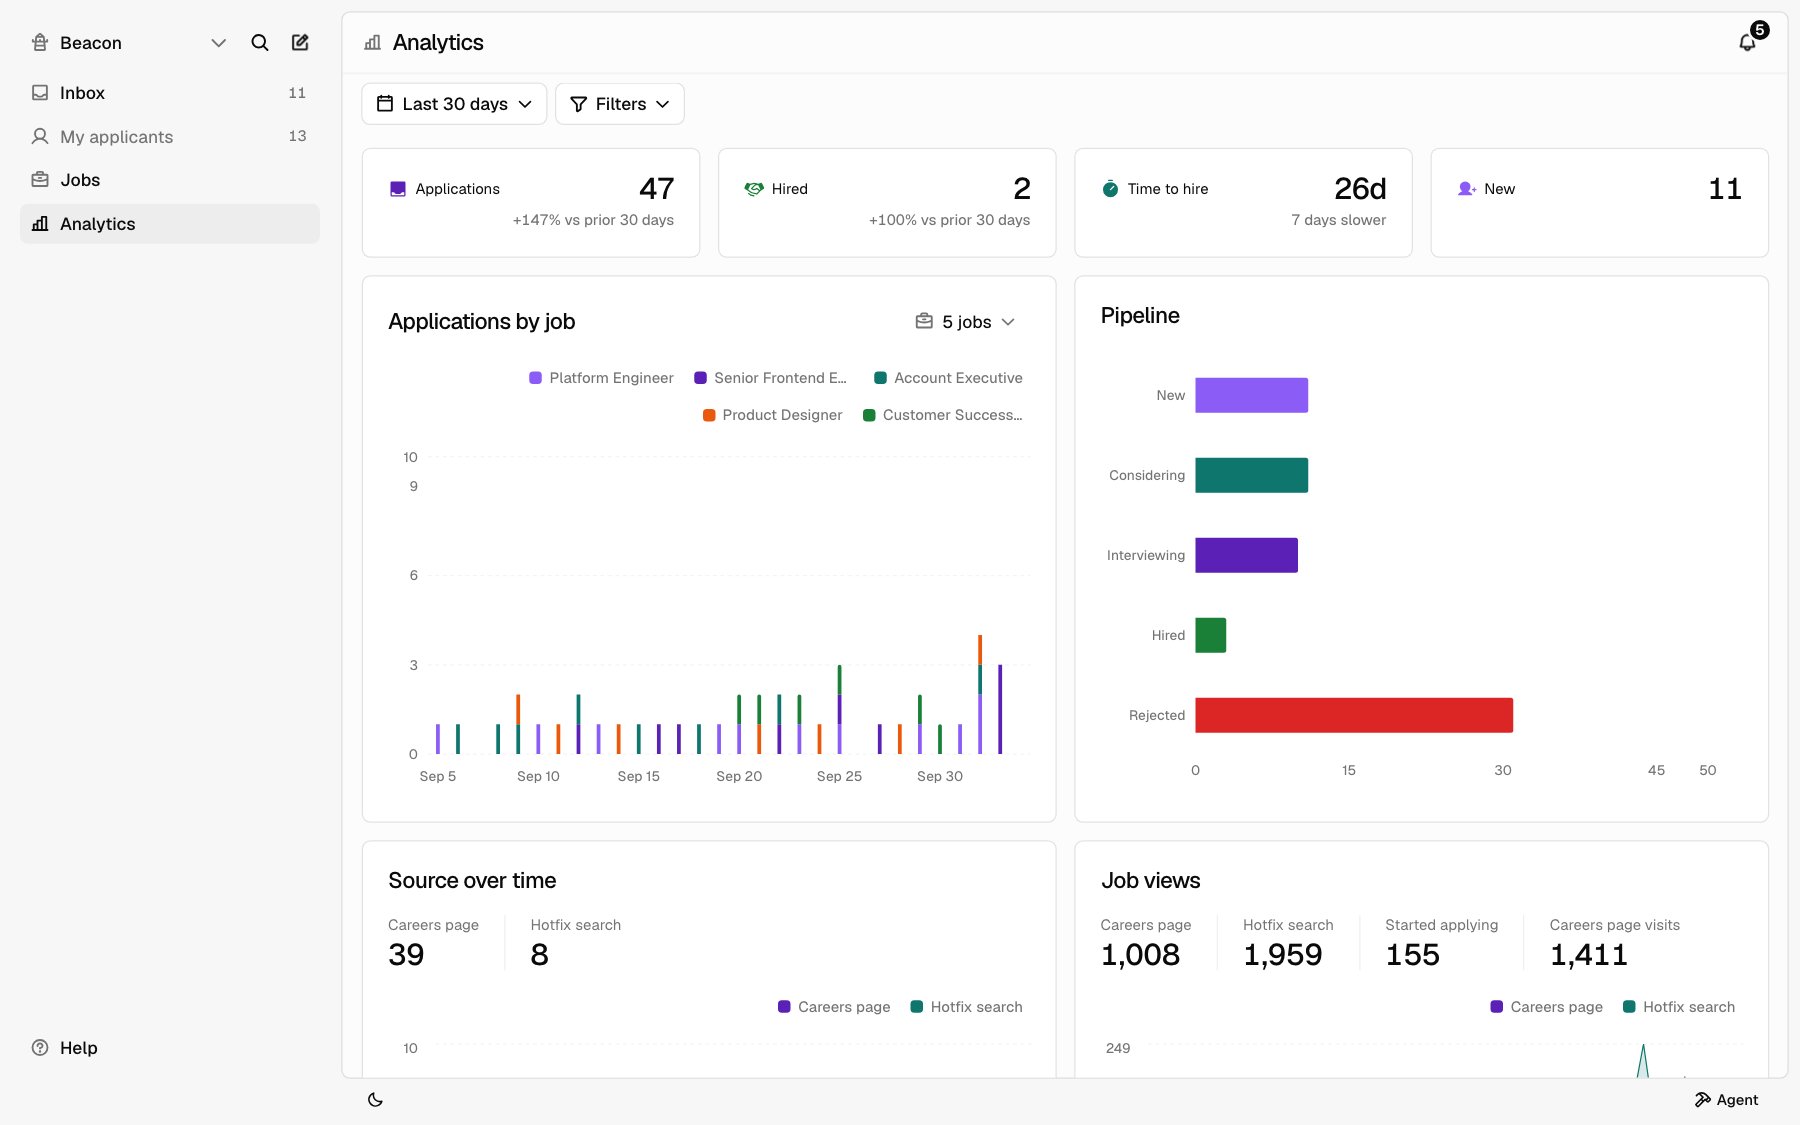
Four cards sit at the top.
Under Applications and Hired, a line shows the percent change from the same number of days just before the range, like vs prior 30 days. Under Time to hire, it says how many days faster or slower you hired, or Same pace. The line is hidden when there’s nothing to compare.
What counts as an application
An application counts on the day it reached your Inbox. Withdrawn applications don’t count. If you turn on Confirm applications under Settings > Apply, applications count once the applicant confirms. See Apply settings.Charts
Pipeline shows where applications are right now, so the date range doesn’t change it. Filters do.
Applications by job
The chart starts with the 5 jobs that have the most applications. To change which jobs it shows, click the jobs button at the top right of the card, like 5 jobs, and check or uncheck jobs. It shows up to 8 at a time.Where applications come from
Source over time splits applications by where the applicant applied:
Applications by channel splits them by the link the applicant followed. A link tagged with
?source=, like ?source=linkedin, counts under that name, like LinkedIn. Applications with no tag count as Direct.
To get a tagged link, open a job and click Copy tracking link. Pick where you’ll share it, like LinkedIn or Referral, or pick Other… to name your own. See Job actions. You can also add ?source= to your careers page link yourself. See Careers page and Where they came from.
Job views
Job views has these totals for the range:Featured jobs
When you filter to one job that’s featured right now, the summary cards change to show the feature:
These count from the day the feature started, not the date range. To feature a job, see Promote a job.
Equal opportunity
Owners and Admins see the Equal opportunity card. It shows answers to the voluntary equal opportunity survey as totals, never by person.- Responses is how many applicants answered the survey.
- Response rate is responses as a share of applications.
- Below, each question shows how many people picked each answer and the percentage. The questions are Gender and Race or ethnicity, plus Veteran status when Federal contractor is on. I don’t wish to answer and Left blank count too. Gender shows Female and Male, like the EEO-1 report. Non-binary answers count under Not reported, with a note saying so.